"Improve or Die," a modification of the French Foreign Legion's unofficial motto – "March or Die" – is appropriate for American metalworking shops. Competition, both foreign and domestic, has never been tougher and the need to improve continually, and to be relentless in increasing productivity has never been greater.
The process for improving performance is simple to explain:
1.Measure what you are now doing.
2.Compare your measurements to what your competitors and peers are doing.
3.Develop a plan to make your performance meet or beat the competition.
4.Execute the plan
5.Measure the results, revise the plan and do it all again. And again and again and again…
The second step of that process was the most difficult to do historically because comparative measurements were not readily available. Today, with the cooperation of hundreds of shops all over the country, the 2007 American Machinist Benchmark Survey provides those measurements. Your responses from that survey enable us to define benchmarks – standards of performance – for a wide range of leading factors that are important to the operation of machine shops. It is the set of benchmarks that machine shops need to complete the second step of their own performance improvement process.
The survey covers a wide range of general business and machine shop specific factors. The entire survey report is available for downloading from the American Machinist website (www.americanmachinist.com) in the Community drop-down menu. In addition to reporting performance for all shops that responded to the survey there are three cross-tabulations: By relationship to customers (captive shops, contract shops and job shops), by number of employees (1 to 20 employees, 21 to 50 employees and more than 50 employees), and by performance (shops that perform in the top 20 percent – called benchmark shops – and all other shops).
The amount of information in the survey report can be overwhelming at first and makes it difficult to identify the most useful factors. Shops that already have a formal process improvement measuring system in place can simply find the factors they monitor and see what the benchmark values for those factors are. For all shops, the following 12 leading indicators are a mixture of metrics that pertain to general business and that are specific to machine shops. These leading indicators provide critical information shops can use to establish a plan to improve their performance and profits.
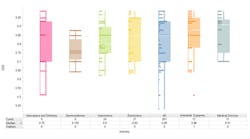
It is important to note that all of the following graphs use average (mean) rather than median (middle-of-thepack) values. Statistical analysis indicates that the averages of the survey responses have a 95 percent probability of being very close to the actual averages of the entire industry and are therefore more meaningful than the median values.
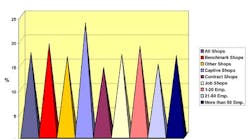
Net Profit Margin is basically the percentage you get to keep of every dollar you earn after paying all of the bills, the infamous "bottom line". The survey results show captive shops with a net profit margin significantly higher than other shops. The values in this graph are slightly different from the values in the benchmark report because a few anomalous cases have been removed before generating the data table and chart. A few companies reported zero net profit margins and it was not clear if this was an actual value or the respondents chose not to give an actual percent.
Return on Invested Capital is the net operating profit after taxes divided by the amount of capital invested. It indicates how well a company is generating a cash flow relative to the capital it has invested in the business. When the return is greater than the cost of capital the company is creating value. Managers who want to know their cost of capital should ask their accountants for the actual number in order to avoid an eye-glazing-over explanation.
Lead TimeCustomer Order Lead Time includes order-entry through production to shipment for a typical product. The shorter lead times for job shops, as compared to captive and contract shops, reflects the pressure job shops are under to deliver more products more quickly. Captive and contract shops also have that pressure but usually are able to spread deliveries over longer time spans.
First PassFinished-product First-pass Quality Yield is the percentage of product that passes final inspection the first time. It is a measure of the ability to provide quality performance and contributes to the very high performance of benchmark shops. Everyone wants to hit the bulls-eye every time. Failing first-pass inspection has a significant negative impact not only on the entire workflow and order process, but also on the moral of employees.
Total Machine Uptime is hours of production as a percentage of plant operations hours per week. In other words, what percentage of an average shift are a shop's machines running. When an employee puts in a day's they get a day's pay regardless of how much or how little was produced. In a machine shop, idle machines are not making money even though the machinist/operator is still getting paid. Therefore, how much a machine is up and running becomes an important metric for determining just how productive and profitable that shop is.
Machine Cycle TimeMachining Cycle Time is the amount of time from start of cutting to completion of cutting for a typical product. Because there is so much variation in the amount of time it takes to machine a "typical" product, this metric may be less useful for the actual values it gives than for the general picture it provides. As usual, benchmark shops do better than other shops, but captive shops do significantly better than all other types of shops. Since there is no readily apparent reason why this is, it will be investigated in more detail at a later time.
The graphs that accompany this report are provided to give a quick visual indication of the differences identified by cross-tabulation of these 12 key metrics. The actual numeric values for all of those metrics is on a table that can be found at www.americanmachinist.com, under the "Community" hotbutton. At the Community site, look for the 12 Key Benchmarks Table.
| The 12 leading indicators and benchmark values presented here are not the only important information contained in the 2007 American Machinist Benchmark Survey report. They are 12 important metrics a shop can use to compare its current operations to the operations of similar competitors and peers. They also are a gift from the hundreds of shop representatives who took the time to fill out the extensive American Machinist Industry Benchmark Survey, and can help all shops to develop the process of improvement needed to follow what should be the unofficial motto of the metalworking industry… "Improve or Die". |
