THE AMERICAN MACHINIST 2006 benchmark survey of the U.S. machine shop industry is a valuable tool that can help to make a shop more efficient and profitable. However, as with any tool—and this is a new one—the user has to know how to use it effectively. • The survey—the first of its kind for the machine shop industry—was designed to develop information that would measure shop operations and to provide a snapshot view of how capable those operations are. • The responses to the survey followed the 80/20 rule in that the top 20 percent of the respondents reported significantly better results than the remaining companies. That natural division led to the development of a dozen key indicators— the things that the top 20 percent do right on a regular basis—that provides them with higher profit. • By keeping track of this set of a dozen indicators, a shop can determine where it is in relationship to its competitors—whether they are around the corner or around the world. Some of these indicators are general and can be applied to any business; the majority are unique to machine shops. • These indicators are not a magical cure for poor shop operations, but they represent the steps that can to be taken to make improvements. Individually, they are incremental factors that can be addressed as individual action toward the development of better business practices. Collectively, they represent a set of good business practices that, if attended to carefully, lead to greater profitability.
THE 12 KEY INDICATORS
- Labor turnover rate (measured as a percent of employment)
- Lost-time injuries/illnesses (measured as the number of incidents — not lost days)
- Average per-unit manufacturing cost, excluding purchased material
- Average machine cycle time (in minutes— for your most typical products)
- Average set-up time (in hours or minutes)
- On-time completion rate (percent)
- Finished-product first-pass quality yield (percent)
- Scrap/rework costs (as a percent of total revenue)
- Shop revenue by man-hour (includes all paid time, including vacation, sick days, etc.)
- Total machine uptime (time machines are in production as a percent of total scheduled operating hours)
- Machine availability (time machines are in use or available for use as a percent of total scheduled operating hours)
- Percent of equipment maintenance that is reactive.
See our June issue. A complete explanation of these 12 key indicators was printed in the June issue of American Machinist, and is available on-line at www.americanmachinist.com
WHO ARE THESE SHOPS?
There are 299 shops that responded to the American Machinist survey and provided the basic information that led to these key indicators.
The survey respondents represent a significant cross section of American industry. Some shops are small, with sales of less than $1 million a year, and are one-man operations. Some are large, with sales of more than $200 million a year, and with more than 200 shop floor employees.
The shops that represent the top 20 percent cut across size differences, and cut across geographic boundaries. They are job shops, contract shops and captive shops located throughout the United States, from Massachusetts to California, from Florida to the state of Washington. The common element that ties them together is that they cut metal on machine tools in a highly competitive world.
| MACHINING PROCESSES AND TECHNIQUES | |
| MACHINING PROCESSES: | |
| 92.7% | turn parts |
| 92.3% | mill parts |
| 87.1% | tap and thread holes |
| 85.1% | drill, bore and ream holes |
| 78.6% | saw parts |
| 65.3% | grind parts |
| 31.1% | broach and/or cut gears |
| 28.2% | multitask |
| 26.6% | heat treat metal |
| 19.4% | wire EDM/ECMs |
| 10.1% | laser cutting |
| 9.7% | water-jet cutting |
| ANNUAL SALES/NUMBER OF EMPLOYEES |
| JOB SHOPS—
|
| CONTRACT SHOPS—
|
| CAPTIVE SHOPS—
|
These shops provide machining work to a wide variety of industries. No one industry dominates as the customer base, and the majority of the shops—72 percent—do most of their work in short runs with a high product mix. The best shops tend to have longer product runs, and that data could be interpreted in two ways: Either the best shops are rewarded by their customers with longer production runs; or, by having longer production runs, shops tend to become more efficient and profitable. Whichever is true, the best shops in the survey have nearly twice as much long-run work as the other shops.
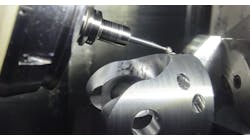
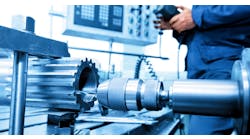
The greatest majority of the shops that responded—more than 92 percent—said the primary machining processes they have in their shops are turning and milling operations. Another 87 percent said they do tapping and threading operations, while 85 percent said they drill, bore and ream holes.
Additionally, 89.7 percent of the shops said they use CNC equipment. Even though nearly 90 percent of the shops that responded to the survey say they use CNC equipment, the results they get from that equipment is not equal. The best shops use that equipment and other assets far more effectively in their operations.
DEFINING "THE BEST"
The single defining feature of the best is profit. Simply put, the best shops are amply rewarded. The top 20 percent of the shops in the survey report a net profit margin of 15.5 percent, more than half again better than the shops in the majority. The other shops report a profit margin of 10 percent.
And, not only are those shops profitable now, they are optimistic about their futures: 60.8 percent of the best shops say they expect revenues in 2007 to increase by more than 6%, while only 44 percent of the other shops are expecting similar revenue gains. Meanwhile, none of the best shops said they expect revenues to fall by more than 6 percent next year; 7 percent of the other shops expect to see their revenues drop that much.
There are other defining features for the best shops, such as the benefits and training that they provide to their employees. As shown in the following charts, the leading shops provide more and a variety of employee benefits to their workers. They also give their employees a greater amount of training than other shops. As one manager said in an interview, often the salary that workers—machinists, machine operators, set-up personnel and others—are paid is not the only incentive that makes them stay on as long-term employees.
Creative benefit packages are characteristic of the best-run shops. Besides the usual packages of healthcare and vacation benefits, such benefit packages include education reimbursement and bonus orprofitsharing plans, and even reach into employee empowerment - that is, the best shops tend to give their employees the ability to make operating decisions without supervisor approval.
The best shops also excel in the uses of advanced management techniques and technologies. By their very nature and design these advanced management programs and advanced technologies promote efficiency and profit, and the benefits they provide are amplified when they are applied in well thought-out plans.
HOW DO THEY DO IT?
The best shops have and maintain business strategies that are designed to make them better. The management tools they use—whether they involve lean manufacturing, continuous improvement programs or Toyota management systems— are put into place to support those basic strategies, and those strategies are focused on one thing: cutting metal.
When it comes to machining, the full weight of their efforts is focused and clear. The best shops put into place technologies—the tools—they need to get their work done efficiently and profitably, and they work on making the most of those tools to get the greatest benefits from them. They do this by maximizing machine cutting time, by presetting tools and prefixturing workpieces, using multitasking and multiple-spindle and multipleaxis machines. All of those combine with reducing machining cycle time and set-up time to decrease per-unit manufacturing costs and drive up profit.
Besides using good machining techniques, the best shops also maintain their equipment and plan capital expenditures to improve their processes and to advance their businesses. Part of being the best requires the maintenance of quality tools, and twice as many of the best shops—36.2 percent compared to 19.1 percent of the other shops—plan to increase their capital spending by more than 10 percent in the next year.
However, cutting parts does not only rely on buying and operating machine tools and enhancing their efficiencies. The best shops also pay close attention to cutting tools, and they take care of those tools. Sharp tools lead to quality cuts, and to less scrap and rework, and the best shops say they recognize the value of high quality cutting tools.
High standards for attaining quality in production also are a part of the best shops' basic business strategies, and are addressed on a continual basis. That is the reason that first-pass quality yield and that reductions in scrap and rework are among the key indicators. Without a constant focus on quality production, the value of the work diminishes, and profits evaporate.
Maintaining that focus on quality provides an important step toward maintaining good customer relationships. The best shops demonstrate their effort in customer relationships by reducing lead times and increasing their percentage of on-time completions for orders.
IN THE CUT
The best shops compete more efficiently and they post greater profit. And greater profit gives those shops options to determine the direction of their operations and their futures.
The increased profit provides greater returns on the investments that owners made for machine tools, cutting tools, ancillary equipment and their facilities. Higher returns on investments make those owners more inclined to spend more on capital equipment, to expand the operations they have.
| WHAT IS YOUR SHOP'S NET PROFIT MARGIN | ||
| (net profit divided by net revenue X 100) | ||
| Top 20% | The Rest | |
| Median | 15.5% | 10.0% |
| Average | 17.1% | 15.3% |
| RETURN ON INVESTED CAPITAL | ||
| (net operating profit after taxes / capital invested) | ||
| Top 20% | The Rest | |
| CURRENT YEAR | ||
| Median | 20.0% | 10.0% |
| Average | 34.6% | 19.0% |
| THREE YEARS AGO | ||
| Median | 12.0% | 5.0% |
| Average | 21.4% | 14.8% |
| INDICATE THE LEVEL OF CAPITAL-EQUIPMENT SPENDING AS A PERCENTAGE OF SALES FOR 2005 | ||
| Top 20% | The Rest | |
| Median | 5.0% | 3.0% |
| Average | 10.5% | 7.3% |
| HUMAN RESOURCES | ||
| Top 20% | The Rest | |
| Paid vacation days | 96.1% | 87.2% |
| Shop-paid medical benefits | 86.3% | 67.7% |
| Annual reviews and raise program | 86.3% | 66.2% |
| Employee training program | 80.4% | 52.8% |
| Education reimbursement | 76.5% | 53.3% |
| Accident prevention program | 70.6% | 50.3% |
| Promotion/advancement opportunities | 66.7% | 46.7% |
| Bonus plan | 49.0% | 36.4% |
| Profit or revenue sharing plan | 43.1% | 31.3% |
| Leader/supervisor development program | 52.9% | 27.2% |
| WHAT IS THE APPROXIMATE AMOUNT SPENT ON TOOLING PER YEAR? | ||
| Top 20% | The Rest | |
| Median | $125,000 | $30,000 |
| Average | $292,377 | $146,826 |
