Real-time inspection only a scan away
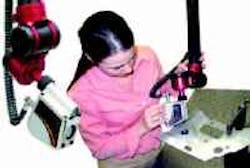
Romer CimCore's portable laserscanning system inspects even difficult-toreach spots on the topside, inside, and underside of a component.
SHOPS GAIN A NEW APPROACH TO measuring thanks to a new portable Laser Scanning Inspection (LSI) system from Romer CimCore, Farmington Hills, Mich. Reportedly the first of its kind, the system combines a 3000i portable coordinate-measuring machine (6/7 axis), a laser scanner, and fullfeatured geometric and surfaceinspection software that includes point-cloud functions. This combination of features lets end users perform real-time geometric and surface inspection to CAD files with a laser scanner or hard probe, generate point clouds for reverse engineering, and output files to CAD applications in a variety of formats.
Romer CimCore expects the main application of this system to involve the inspection of large sheetmetal components, such as automotive bodywork. The parts are produced to a high level of accuracy, and it is essential to ensure that they fit together successfully — particularly important when using robots for assembly and welding.
The LSI system collects and analyzes more than 20,000 points/sec, allowing more detailed inspections of geometric and surface features than is practical with a physical probe. Fitting the laser to a portable and flexible inspection arm ensures that data can be collected from all areas of the component in a single operation.
The collected data can be analyzed in a number of ways. Applying a filter to the points shows only those out of tolerance. Alternatively, a color gradient, which indicates whether the points are in tolerance, above tolerance, or below tolerance, produces an instant color "weather map" of component accuracy.
Because users gather large volumes of data and can quickly and easily interpret results, they can identify trends in the measurements much earlier — possibly even before the parts have moved out of tolerance. They, therefore, can remove problem components from a line before any further work is completed on them. Similarly, any drift in accuracy, for example as a result of worn tooling, can be identified before large numbers of defective items have been produced.
